Monitoring, Troubleshooting & Audit
Monitoring in AWS
- AWS CloudWatch:
- Metrics: Collect and track key metrics
- Logs: Collect, monitor, analyze and store log files
- Events: Send notifications when certain events happen in your AWS
- Alarms: React in real-time to metrics / events
- AWS X-Ray:
- Troubleshooting application performance and errors
- Distributed tracing of microservices
- AWS CloudTrail:
- Internal monitoring of API calls being made
- Audit changes to AWS Resources by your users
CloudWatch Metrics
- CloudWatch provides metrics for every services in AWS
- Metric is a variable to monitor (CPUUtilization, NetworkIn…)
- Metrics belong to namespaces
- Dimension is an attribute of a metric (instance id, environment, etc…).
- Up to 30 dimensions per metric
- Metrics have timestamps
- Can create CloudWatch dashboards of metrics
EC2 Detailed monitoring
- EC2 instance metrics have metrics “every 5 minutes”
- With detailed monitoring (for a cost), you get data “every 1 minute”
- Use detailed monitoring if you want to scale faster for your ASG!
- The AWS Free Tier allows us to have 10 detailed monitoring metrics
- Note: EC2 Memory usage is by default not pushed (must be pushed from inside the instance as a custom metric)
CloudWatch Custom Metrics
- Possibility to define and send your own custom metrics to CloudWatch
- Example: memory (RAM) usage, disk space, number of logged in users …
- Use API call PutMetricData
- Ability to use dimensions (attributes) to segment metrics
- Instance.id
- Environment.name
- Metric resolution (StorageResolution API parameter – two possible value):
- Standard: 1 minute (60 seconds)
- High Resolution: 1/5/10/30 second(s) – Higher cost
- Important: Accepts metric data points two weeks in the past and two hours in the future (make sure to configure your EC2 instance time correctly)
CloudWatch Logs
- Log groups: arbitrary name, usually representing an application
- Log stream: instances within application / log files / containers
- Can define log expiration policies (never expire, 1 day to 10 years…)
- CloudWatch Logs can send logs to:
- Amazon S3 (exports)
- Kinesis Data Streams
- Kinesis Data Firehose
- AWS Lambda
- OpenSearch
- Logs are encrypted by default
- Can setup KMS-based encryption with your own keys
Sources
- SDK, CloudWatch Logs Agent, CloudWatch Unified Agent
- Elastic Beanstalk: collection of logs from application
- ECS: collection from containers
- AWS Lambda: collection from function logs
- VPC Flow Logs: VPC specific logs
- API Gateway
- CloudTrail based on filter
- Route53: Log DNS queries
Logs Insights
- Search and analyze log data stored in CloudWatch Logs (dashboard like view)
- Example: find a specific IP inside a log, count occurrences of “ERROR” in your logs…
- Provides a purpose-built query language
- Automatically discovers fields from AWS services and JSON log events
- Fetch desired event fields, filter based on conditions, calculate aggregate statistics, sort events, limit number of events…
- Can save queries and add them to CloudWatch Dashboards
- Can query multiple Log Groups in different AWS accounts
- It’s a query engine, not a real-time engine
S3 Export
- Log data can take up to 12 hours to become available for export
- The API call is CreateExportTask
- Not near-real time or real-time… use Logs Subscriptions instead
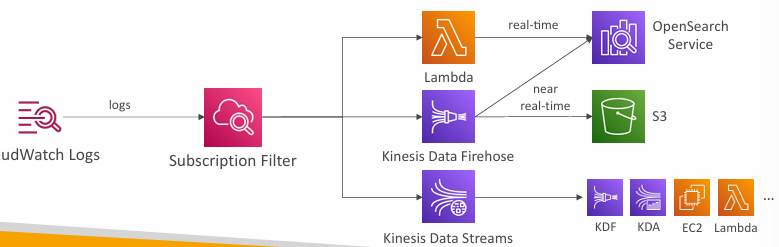
Logs Subscriptions
- Get a real-time log events from CloudWatch Logs for processing and analysis
- Send to Kinesis Data Streams, Kinesis Data Firehose, or Lambda
- Subscription Filter – filter which logs are events delivered to your destination
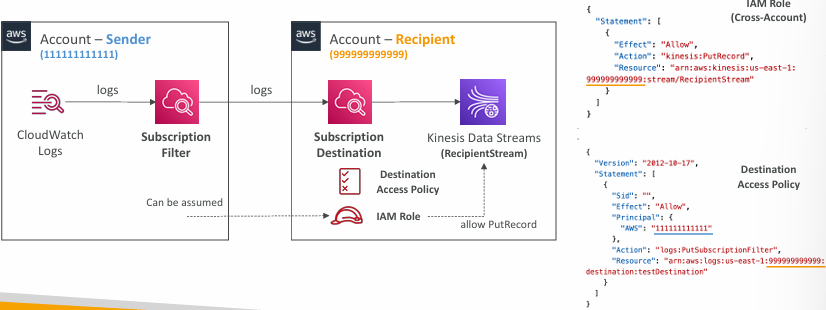
Logs Aggregation Multi-Account & Multi Region
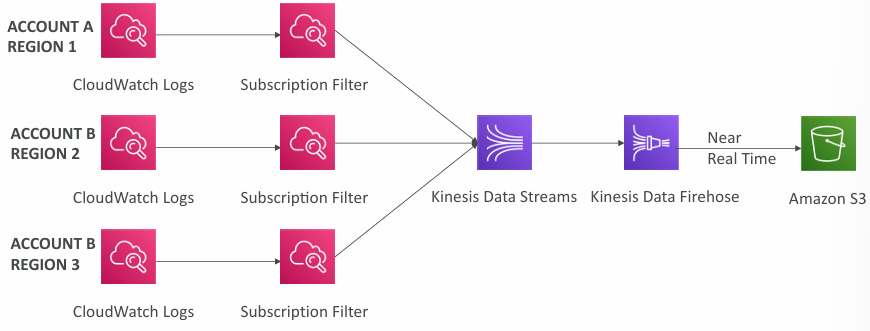
- Cross-Account Subscription – send log events to resources in a different AWS account (KDS, KDF)
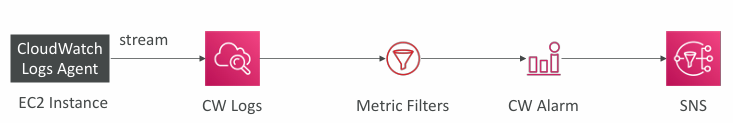
Logs for EC2
- By default, no logs from your EC2 machine will go to CloudWatch
- You need to run a CloudWatch agent on EC2 to push the log files you want
- Make sure IAM permissions are correct
- The CloudWatch log agent can be setup on-premises too
Logs Agent & Unified Agent
- For virtual servers (EC2 instances, on-premise servers…)
- CloudWatch Logs Agent
- Old version of the agent
- Can only send to CloudWatch Logs
- CloudWatch Unified Agent
- Collect additional system-level metrics such as RAM, processes, etc…
- Collect logs to send to CloudWatch Logs
- Centralized configuration using SSM Parameter Store
Unified Agent – Metrics
- Collected directly on your Linux server / EC2 instance
- CPU (active, guest, idle, system, user, steal)
- Disk metrics (free, used, total), Disk IO (writes, reads, bytes, iops)
- RAM (free, inactive, used, total, cached)
- Netstat (number of TCP and UDP connections, net packets, bytes)
- Processes (total, dead, bloqued, idle, running, sleep)
- Swap Space (free, used, used %)
- Reminder: out-of-the box metrics for EC2 – disk, CPU, network (high level)
Logs Metric Filter
- CloudWatch Logs can use filter expressions
- For example, find a specific IP inside of a log
- Or count occurrences of “ERROR” in your logs
- Metric filters can be used to trigger alarms
- Filters do not retroactively filter data. Filters only publish the metric data points for events that happen after the filter was created.
- Ability to specify up to 3 Dimensions for the Metric Filter (optional)
Alarms
- Alarms are used to trigger notifications for any metric
- Various options (sampling, %, max, min, etc…)
- Alarm States:
- OK
- INSUFFICIENT_DATA
- ALARM
- Period:
- Length of time in seconds to evaluate the metric
- High resolution custom metrics: 10 sec, 30 sec or multiples of 60 sec
Alarm Targets
- Stop, Terminate, Reboot, or Recover an EC2 Instance
- Trigger Auto Scaling Action
- Send notification to SNS (from which you can do pretty much anything)
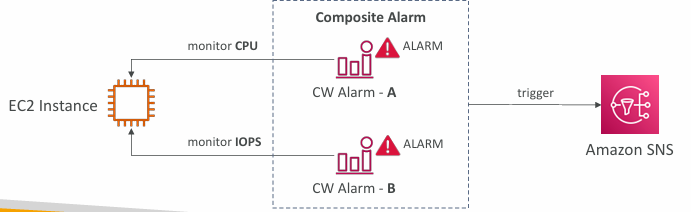
Composite Alarms
- CloudWatch Alarms are on a single metric
- Composite Alarms are monitoring the states of multiple other alarms
- AND and OR conditions
- Helpful to reduce “alarm noise” by creating complex composite alarms
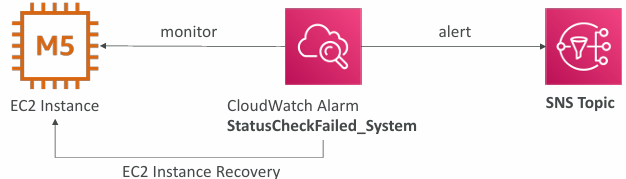
EC2 Instance Recovery
- Status Check:
- Instance status = check the EC2 VM
- System status = check the underlying hardware
- Attached EBS status = check attached EBS volumes
- Recovery: Same Private, Public, Elastic IP, metadata, placement group
CloudWatch Alarms: good to know
- Alarms can be created based on CloudWatch Logs Metrics Filters
- To test alarms and notifications, set the alarm state to Alarm using CLI
aws cloudwatch set-alarm-state --alarm-name "myalarm" --state-value ALARM --state-reason "testing purposes"
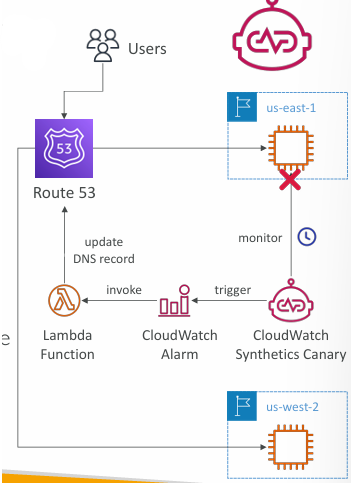
Synthetics Canary
- Configurable script that monitor your APIs, URLs, Websites, …
- Reproduce what your customers do programmatically to find issues before customers are impacted
- Checks the availability and latency of your endpoints and can store load time data and screenshots of the UI
- Integration with CloudWatch Alarms
- Scripts written in Node.js or Python
- Programmatic access to a headless Google Chrome browser
- Can run once or on a regular schedule
Synthetics Canary Blueprints
- Heartbeat Monitor – load URL, store screenshot and an HTTP archive file
- API Canary – test basic read and write functions of REST APIs
- Broken Link Checker – check all links inside the URL that you are testing
- Visual Monitoring – compare a screenshot taken during a canary run with a baseline screenshot
- Canary Recorder – used with CloudWatch Synthetics Recorder (record your actions on a website and automatically generates a script for that)
- GUI Workflow Builder – verifies that actions can be taken on your webpage (e.g., test a webpage with a login form)
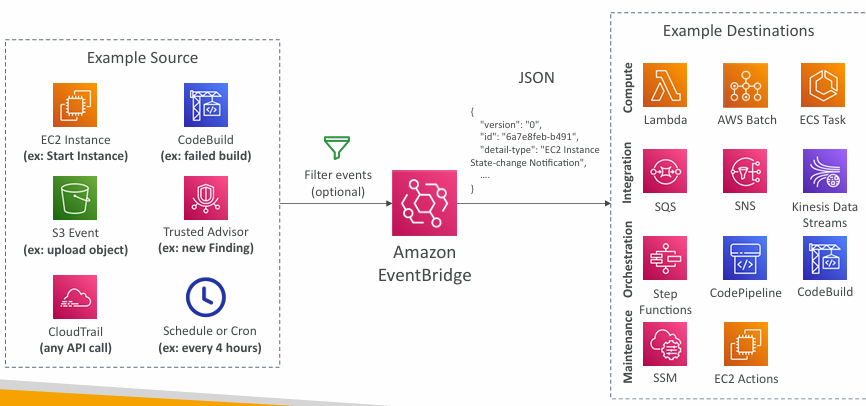
EventBridge (formerly CloudWatch Events)
- Schedule: Cron jobs (scheduled scripts)
- Event Pattern: Event rules to react to a service doing something
- Trigger Lambda functions, send SQS/SNS messages…
Rules
- Event buses can be accessed by other AWS accounts using Resource-based Policies
- You can archive events (all/filter) sent to an event bus (indefinitely or set period)
- Ability to replay archived events
Schema Registry
- EventBridge can analyze the events in your bus and infer the schema
- The Schema Registry allows you to generate code for your application, that will know in advance how data is structured in the event bus
- Schema can be versioned
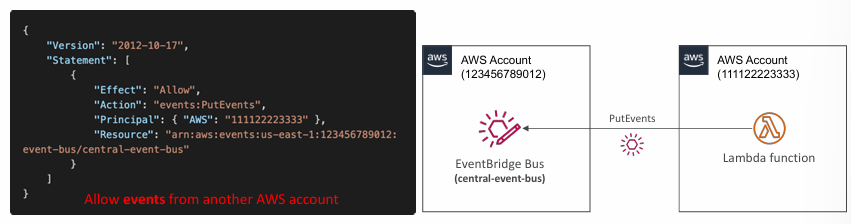
Resource-based Policy
- Manage permissions for a specific Event Bus
- Example: allow/deny events from another AWS account or AWS region
- Use case: aggregate all events from your AWS Organization in a single AWS account or AWS region (Multi-account Aggregation)
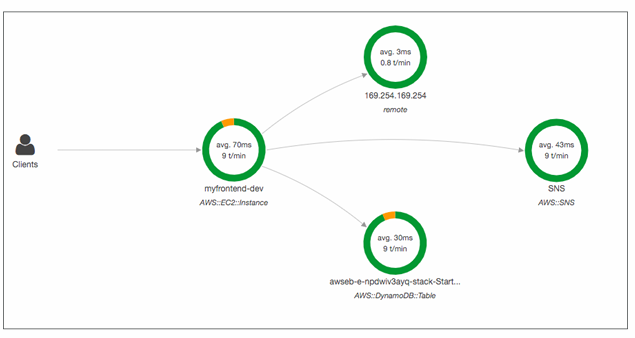
AWS X-Ray
- Monitoring for distributed services
- X-Ray service collects data from all the different services
- Service map is computed from all the segments and traces
- X-Ray is graphical, so even non technical people can help troubleshoot
Advantages:
- Troubleshooting performance (bottlenecks)
- Understand dependencies in a microservice architecture
- Pinpoint service issues
- Review request behavior
- Find errors and exceptions
- Are we meeting time SLA?
- Where I am throttled?
- Identify users that are impacted
Compatibility
- AWS Lambda
- Elastic Beanstalk
- ECS
- ELB
- API Gateway
- EC2 Instances or any application server (even on premise)
Tracing
- Tracing is an end to end way to following a “request”
- Each component dealing with the request adds its own “trace”
- Tracing is made of segments (+ sub segments)
- Annotations can be added to traces to provide extra-information
- Ability to trace:
- Every request
- Sample request (as a % for example or a rate per minute)
- X-Ray Security:
- IAM for authorization
- KMS for encryption at rest
Enabling X-Ray
- Your code (Java, Python, Go, Node.js, .NET) must import the AWS X-Ray SDK
- Very little code modification needed
- The application SDK will then capture:
- Calls to AWS services
- HTTP / HTTPS requests
- Database Calls (MySQL, PostgreSQL, DynamoDB)
- Queue calls (SQS)
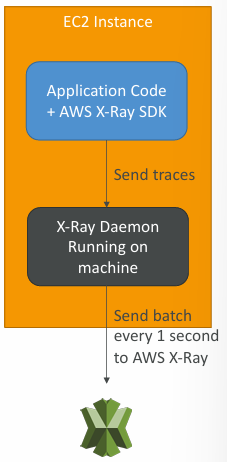
- Install the X-Ray daemon or enable X-Ray AWS Integration
- X-Ray daemon works as a low level UDP packet interceptor (Linux / Windows / Mac…)
- AWS Lambda / other AWS services already run the X-Ray daemon for you
- Each application must have the IAM rights to write data to X-Ray
X-Ray Troubleshooting
- If X-Ray is not working on EC2
- Ensure the EC2 IAM Role has the proper permissions
- Ensure the EC2 instance is running the X-Ray Daemon
- To enable on AWS Lambda
- Ensure it has an IAM execution role with proper policy (AWSX-RayWriteOnlyAccess)
- Ensure that X-Ray is imported in the code
- Enable Lambda X-Ray Active Tracing
X-Ray Instrumentation in your code
- To instrument your application code, you use the X-Ray SDK
- Many SDK require only configuration changes
- You can modify your application code to customize and annotation the data that the SDK sends to X-Ray, using interceptors, filters, handlers, middleware…
X-Ray Concepts
- Segments: each application / service will send them
- Subsegments: if you need more details in your segment
- Trace: segments collected together to form an end-to-end trace
- Sampling: decrease the amount of requests sent to X-Ray, reduce cost
- Annotations: Key Value pairs used to index traces and use with filters
- Metadata: Key Value pairs, not indexed, not used for searching
The X-Ray daemon / agent has a config to send traces cross account:
- Make sure the IAM permissions are correct – the agent will assume the role
- This allows to have a central account for all your application tracing
Sampling Rules
- With sampling rules, you control the amount of data that you record
- You can modify sampling rules without changing your code
- By default, the X-Ray SDK records the first request each second, and five percent of any additional requests.
- One request per second is the reservoir, which ensures that at least one trace is recorded each second as long the service is serving requests.
- Five percent is the rate at which additional requests beyond the reservoir size are sampled.
- You can create your own rules with the reservoir and rate
X-Ray Write APIs (used by the X-Ray daemon)
- PutTraceSegments: Uploads segment documents to AWS X-Ray
- PutTelemetryRecords: Used by the AWS X-Ray daemon to upload telemetry
- SegmentsReceivedCount, SegmentsRejectedCounts, BackendConnectionErrors…
- GetSamplingRules: Retrieve all sampling rules (to know what/when to send)
- GetServiceGraph: main graph
- BatchGetTraces: Retrieves a list of traces specified by ID. Each trace is a collection of segment documents that originates from a single request
- The X-Ray daemon needs to have an IAM policy authorizing the correct API calls to function correctly
- GetTraceSummaries: Retrieves IDs and annotations for traces available for a specified time frame using an optional filter. To get the full traces, pass the trace IDs to BatchGetTraces
- GetTraceGraph: Retrieves a service graph for one or more specific trace IDs
Integrations
X-Ray with Elastic Beanstalk
- AWS Elastic Beanstalk platforms include the X-Ray daemon
- You can run the daemon by setting an option in the Elastic Beanstalk console or with a configuration file (in .ebextensions/xray-daemon.config)
- Make sure to give your instance profile the correct IAM permissions so that the X-Ray daemon can function correctly
- Then make sure your application code is instrumented with the X-Ray SDK
- Note: The X-Ray daemon is not provided for Multicontainer Docker
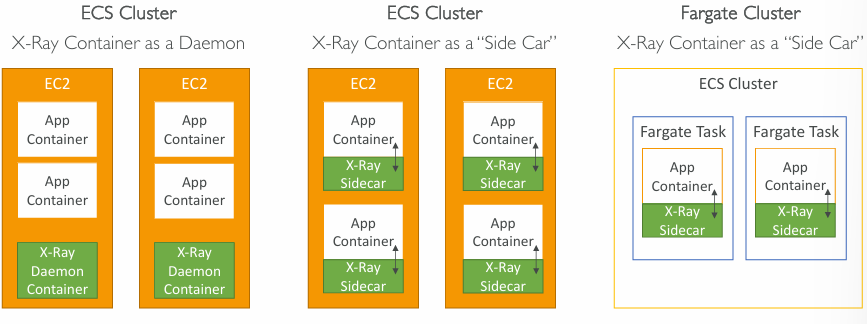
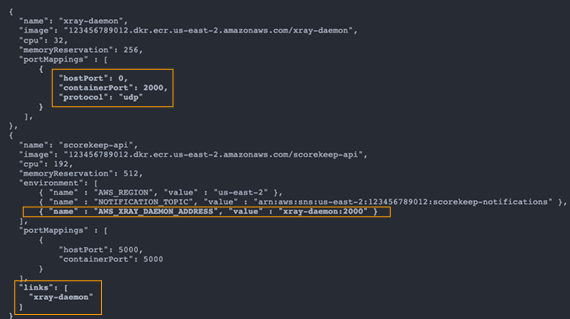
ECS + X-Ray integration options
Example Task Definition:
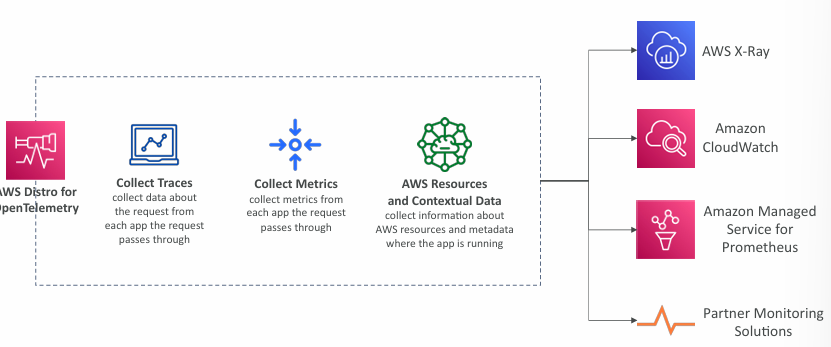
AWS Distro for OpenTelemetry
- Secure, production-ready AWS-supported distribution of the open-source project OpenTelemetry project
- Provides a single set of APIs, libraries, agents, and collector services
- Collects distributed traces and metrics from your apps
- Collects metadata from your AWS resources and services
- Auto-instrumentation Agents to collect traces without changing your code
- Send traces and metrics to multiple AWS services and partner solutions
- X-Ray, CloudWatch, Prometheus…
- Instrument your apps running on AWS (e.g., EC2, ECS, EKS, Fargate, Lambda) as well as on-premises
- Migrate from X-Ray to AWS Distro for Temeletry if you want to standardize with open-source APIs from Telemetry or send traces to multiple destinations simultaneously
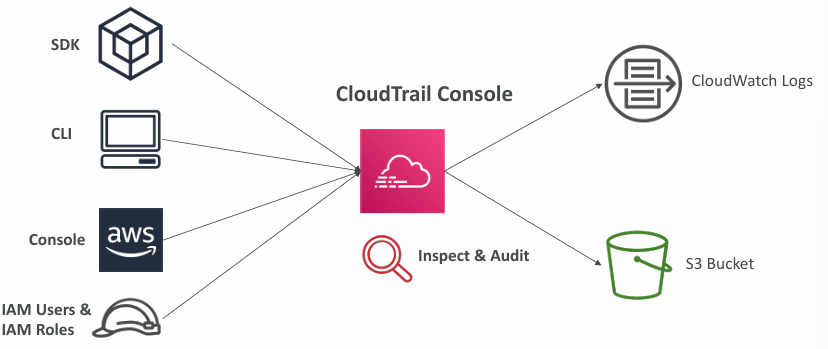
AWS CloudTrail
- Provides governance, compliance and audit for your AWS Account
- CloudTrail is enabled by default!
- Get an history of events / API calls made within your AWS Account by:
- Console
- SDK
- CLI
- AWS Services
- Can put logs from CloudTrail into CloudWatch Logs or S3
- A trail can be applied to All Regions (default) or a single Region.
- If a resource is deleted in AWS, investigate CloudTrail first!
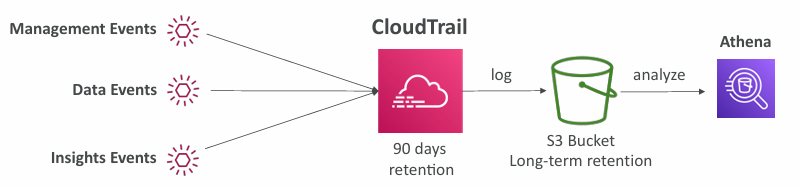
Events
- Management Events:
- Operations that are performed on resources in your AWS account
- Examples:
- Configuring security (IAM AttachRolePolicy)
- Configuring rules for routing data (Amazon EC2 CreateSubnet)
- Setting up logging (AWS CloudTrail CreateTrail)
- By default, trails are configured to log management events.
- Can separate Read Events (that don’t modify resources) from Write Events (that may modify resources)
- Data Events:
- By default, data events are not logged (because high volume operations)
- Amazon S3 object-level activity (ex: GetObject, DeleteObject, PutObject): can separate Read and Write Events
- AWS Lambda function execution activity (the Invoke API)
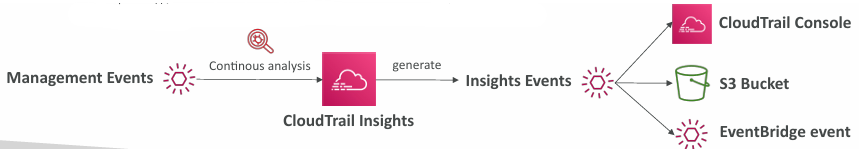
- CloudTrail Insights Events to detect unusual activity in your account:
- inaccurate resource provisioning
- hitting service limits
- Bursts of AWS IAM actions
- Gaps in periodic maintenance activity
- CloudTrail Insights analyzes normal management events to create a baseline
- And then continuously analyzes write events to detect unusual patterns
- Anomalies appear in the CloudTrail console
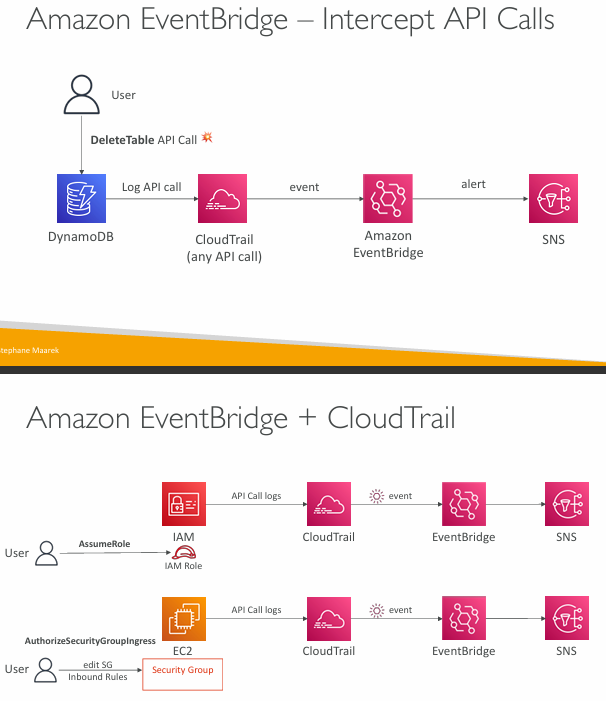
- Event is sent to Amazon S3
- An EventBridge event is generated (for automation needs)
Events Retention
- Events are stored for 90 days in CloudTrail
- To keep events beyond this period, log them to S3 and use Athena
Examples
CloudTrail vs CloudWatch vs X-Ray
- CloudTrail:
- Audit API calls made by users / services / AWS console
- Useful to detect unauthorized calls or root cause of changes
- CloudWatch:
- CloudWatch Metrics over time for monitoring
- CloudWatch Logs for storing application log
- CloudWatch Alarms to send notifications in case of unexpected metrics
- X-Ray:
- Automated Trace Analysis & Central Service Map Visualization
- Latency, Errors and Fault analysis
- Request tracking across distributed systems